Hello Acitve Traders / Market Enthusists,
Last week the financial markets continued to sell off in bear market territory, which means we are. or were for a period of time, off more than 30% of recent highs of 369.25 on 2/19/2020, making a low so far of 247.68 on Thursday to close the week yesterday with a short covering rally near the end of the day to close at 269.32.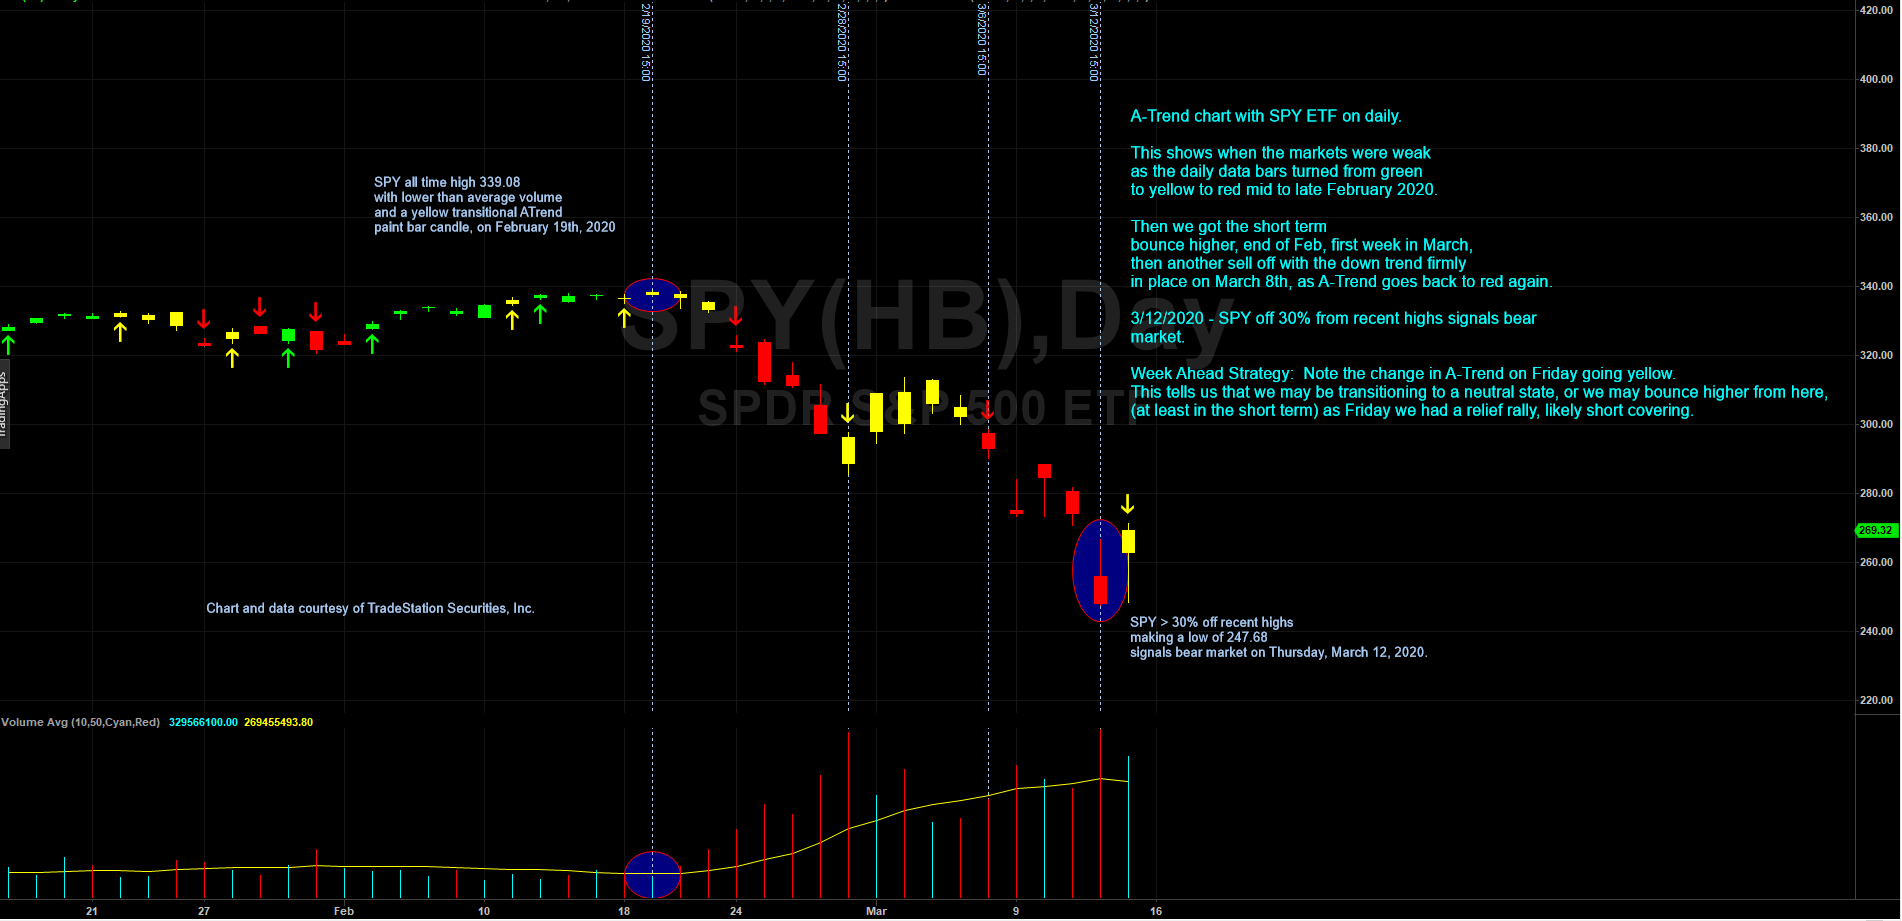
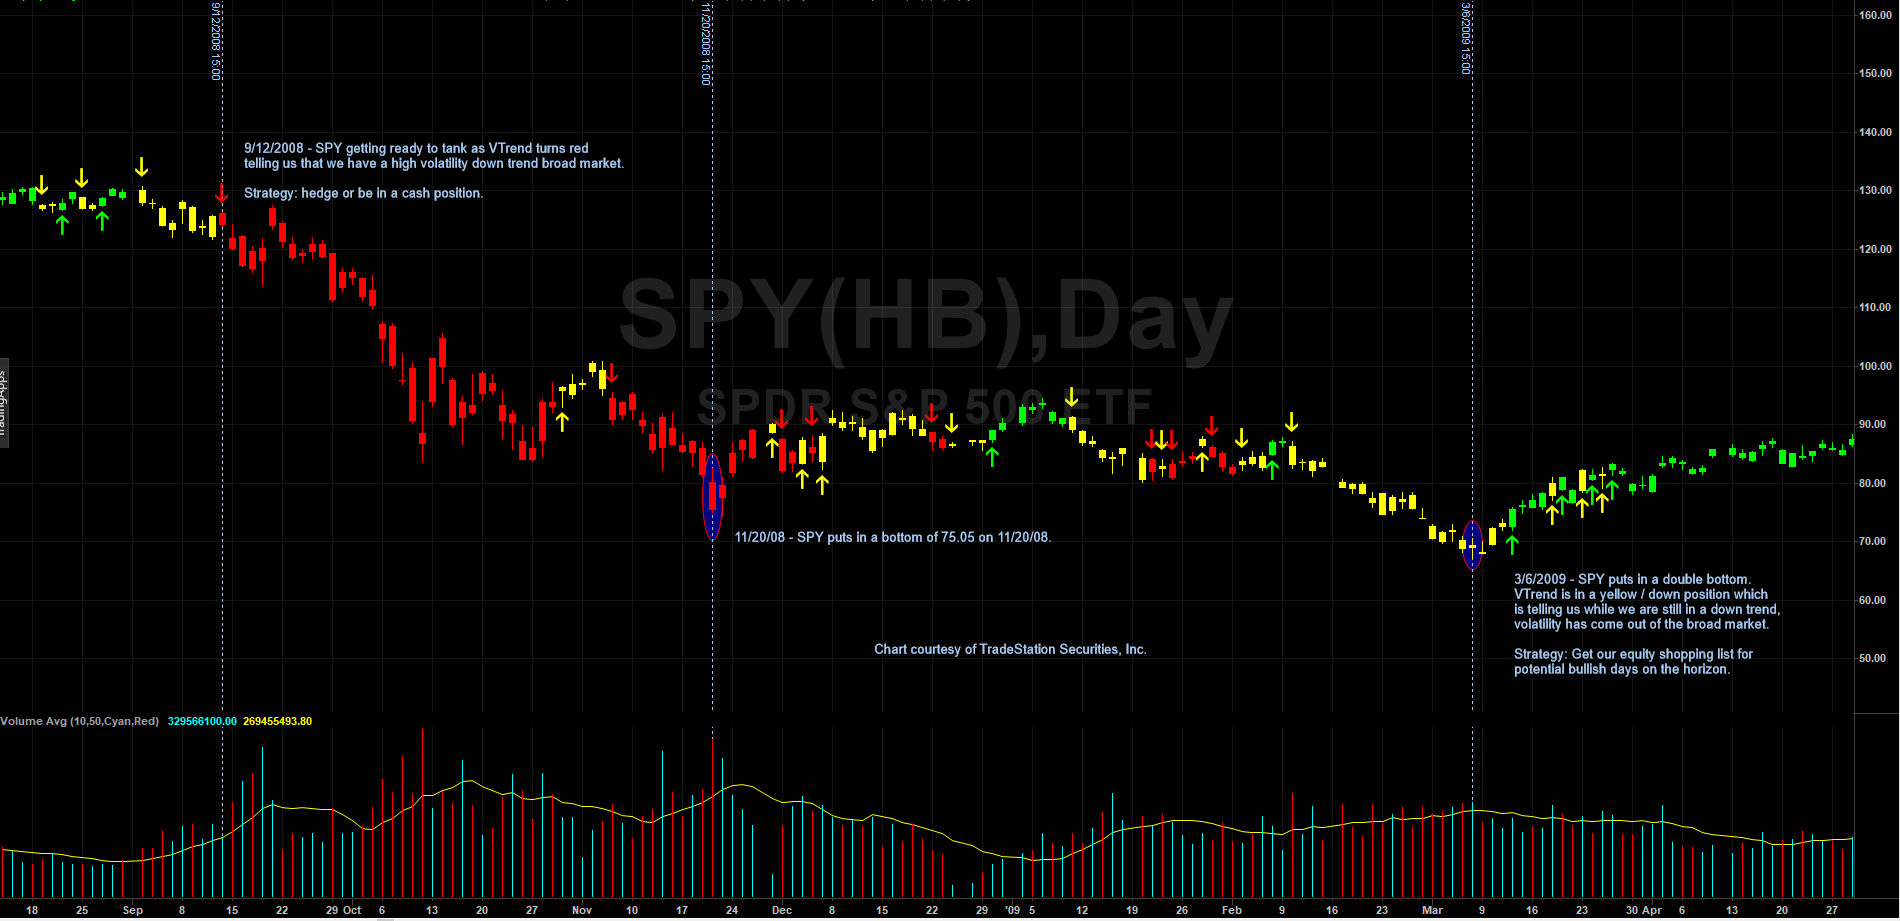
For us to put things in perspective, take a look at the next chart, which shows what transpired during the great recession of 2008, leading to a nasty decline, before the markets finally recovered to then go on to provide the longest bull market run in the history of the US stock market:
Now take a look at our current situation on a VTrend chart:
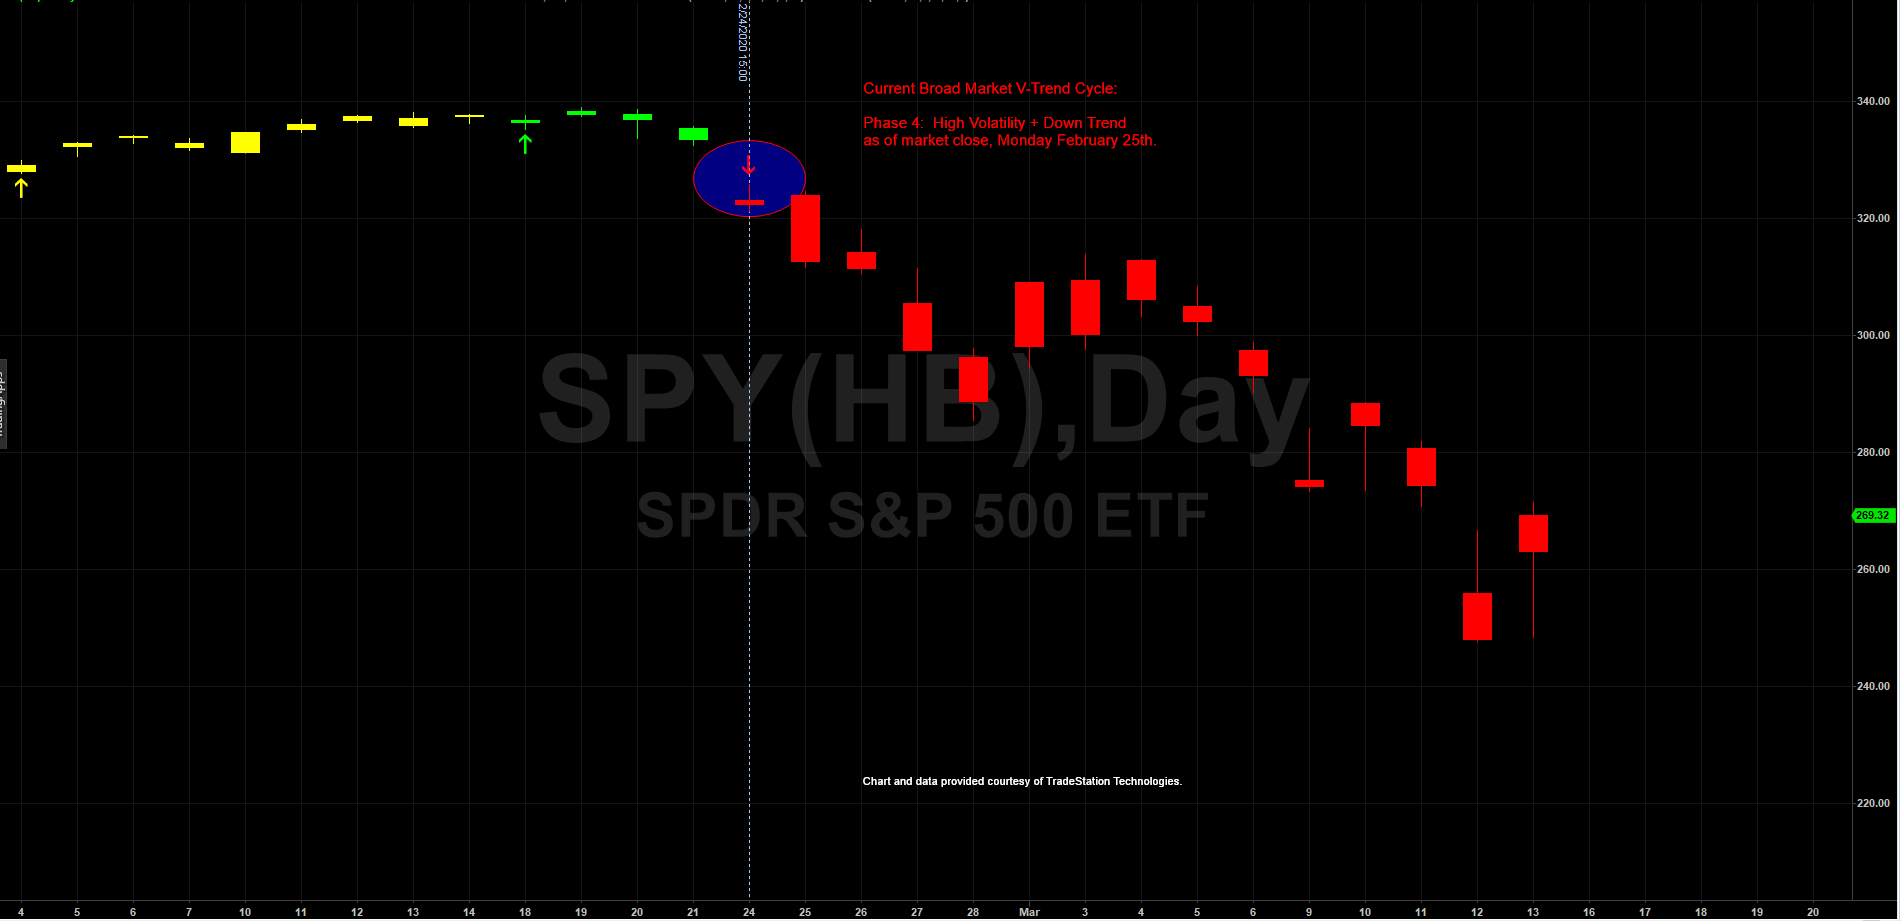
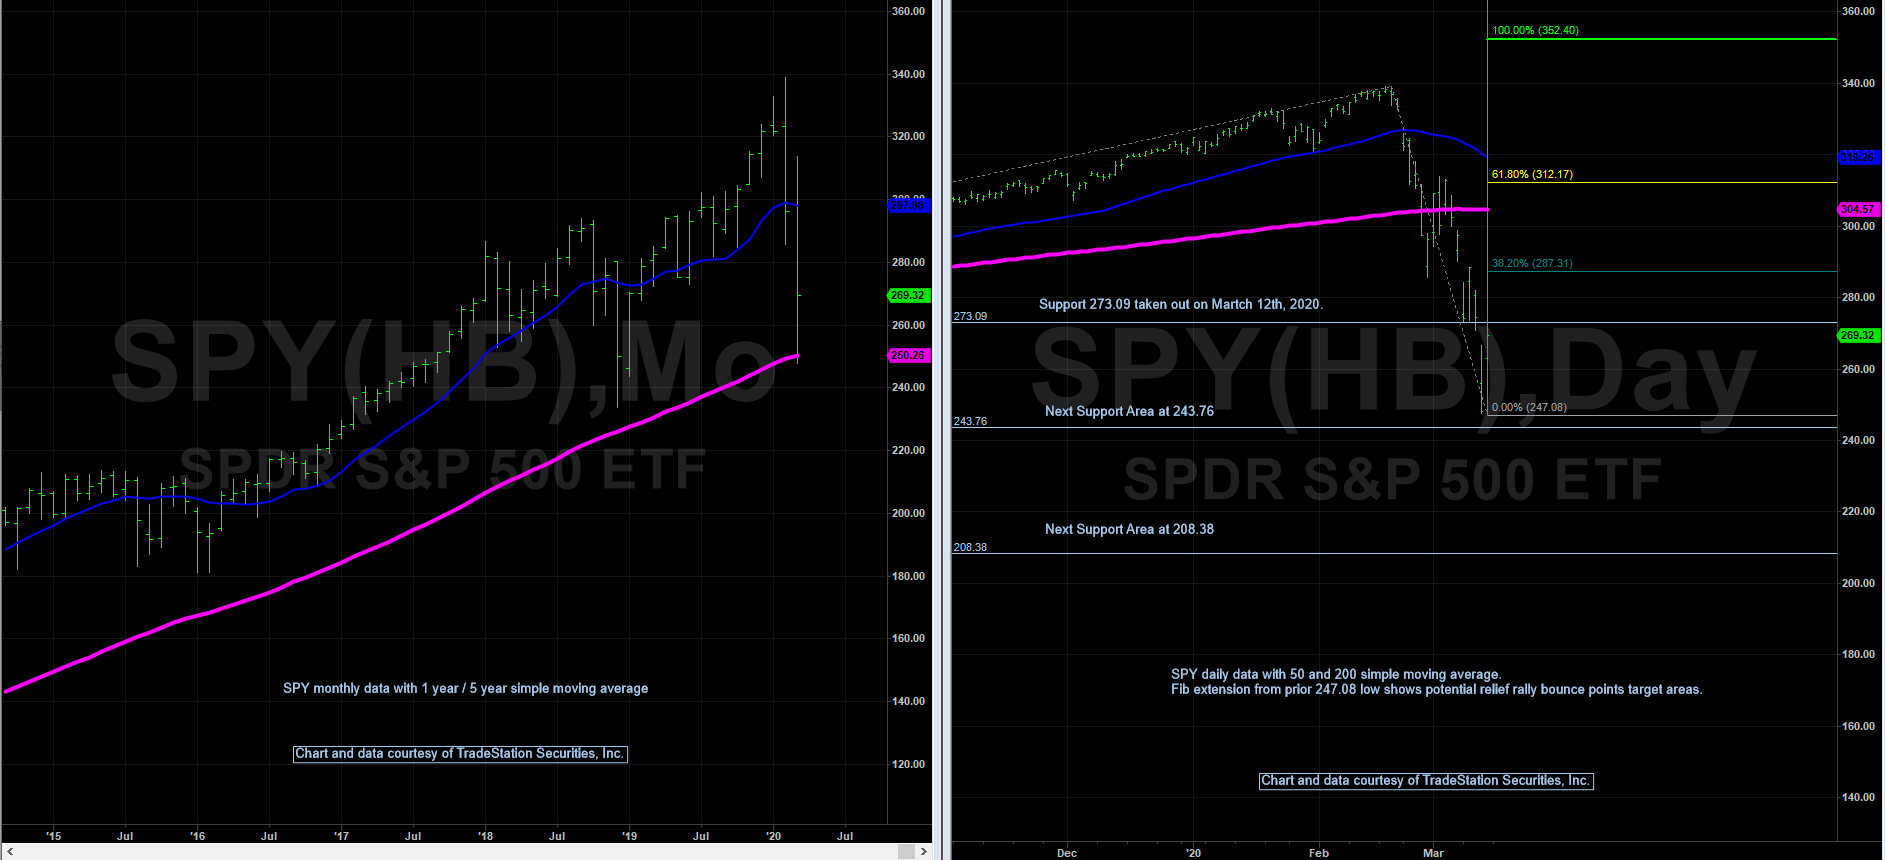
From the above chart, you can see the similarities to the crash of 2008. Now, let's take a look at current support levels, and where we may go with a beark market bounce, relief rally using fib extenstions to give us an idea of possible scenarios going forward from where we are currently:
It is currently very much a traders market, if one knows how to properly read market internals to take advantage of the high volatilte market climate. It's not for the faint of heart, but the more experienced. If you are in cash, or looking to get back in the market, we want to find some confirmed support with both A-Trend and V-Trend minimally putting in some yellow / green candles.