The four stock market volatility cycles are as follows:
- up / neutral trend transitioning to a potential stronger up trend
- stronger up trend with lower volatility
- down / neutral trend transitioning to a potential stronger down trend
- stronger down trend with higher volatility
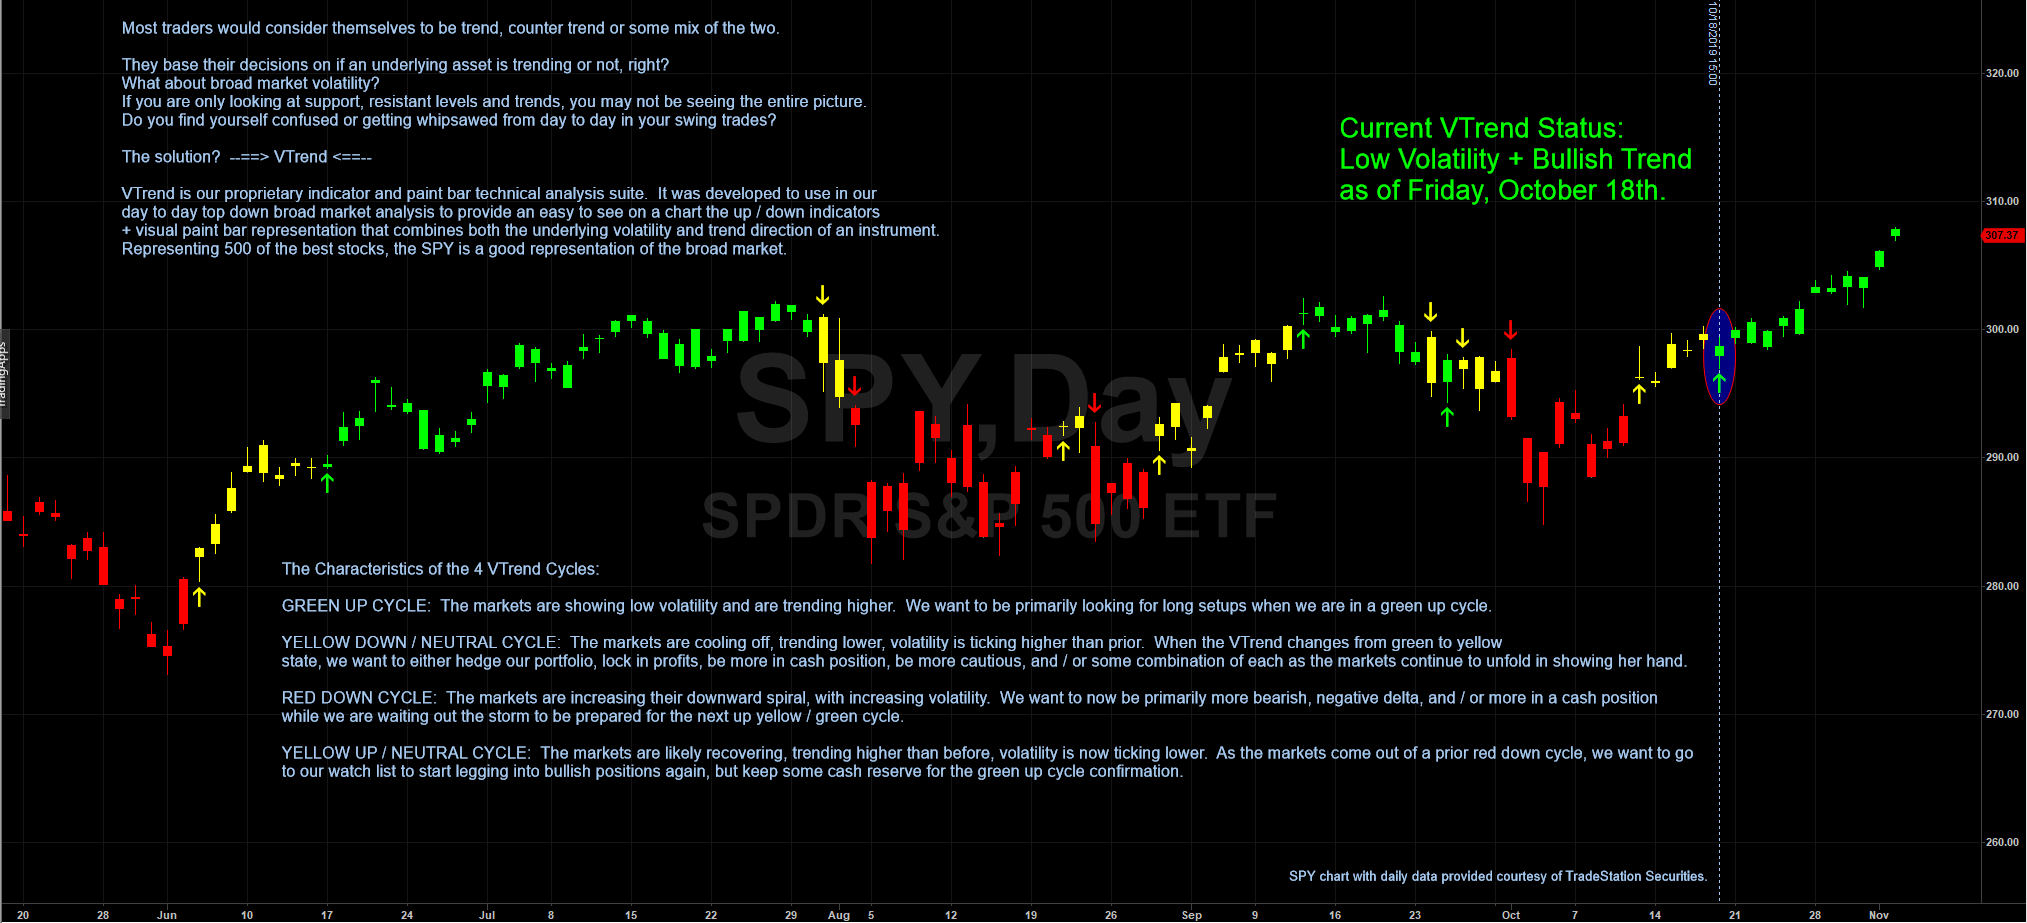
VTrend is our volatility trend paint bar and indicator tool suite. When put on an index, such as the SPX with daily or weekly data, it combines what we believe is a snapshot of the current trend of the underlying with a measure of volatility in an easy to view and use for top down market technical analysis.
In this way, the astute trader can quickly and easily understand what is the current state of the overall broad markets. This is important to know for potential market shifts and whether to be more bullish, bearish, or whether to be hedge or not for an overall portfolio perspective.