VTrend2 turns red on Friday - The Broad Market Cycle has the potential to move lower in the coming days / weeks ahead.
Price action sells off Friday marking 7 days where close < open out of 9, with the VTrend2 (my recently revised market cycle trend analysis tool!) turns red as of Fridays close. |
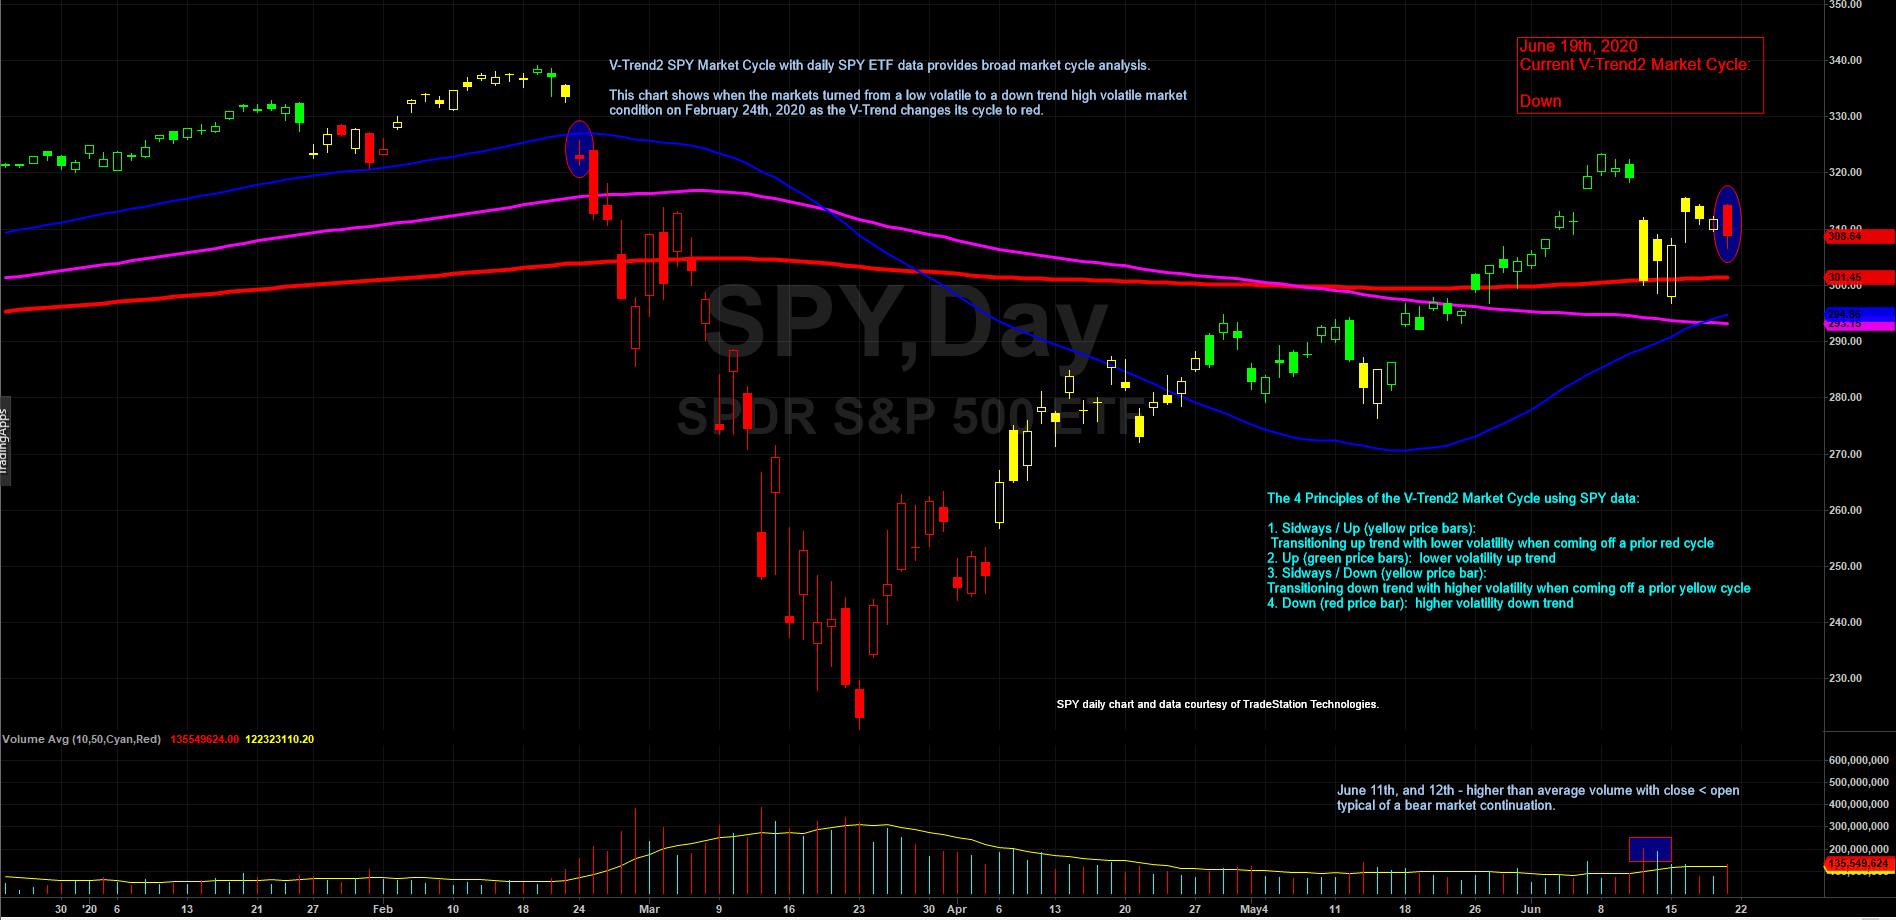
You will also want to take a good long look at the SPY chart below. It is the most recent Broad Market Cycle analysis from this past Friday as of the market close. The chart above is of the the SPY with Volatility Trend2, my revised proprietary market cycle trending technology that I developed for my own trading to give me an easy to read visual representation of the current market cycle of a broad market index. When used on the SPY ETF, I call it the "Broad Market Cycle" since the SPY is comprised of the 500 strongest stocks in the United States and is considered a very good measure of the overall US financial "broad markets." The question becomes, where will they go from here? With last weeks bearish action, I took action to put on a VXX hedge last week. I am considering adding or putting on an additional hedge this week if we continue to drive lower in the week ahead, especially if we are moving lower into the moving averages and / or penetrate through them without a bounce higher off of them. These are key areas that the broad markets need to hold for bulls to remain in control. |