Happy Monday! I hope this finds you doing well today. The markets have settled down quite a bit in the prior weeks with the SPY ETF consolidating just under a major resistance area. In recent weeks, since the March 23rd low was put in, there have been many growth stock names that have really taken off and are showing continued strength working to prove themselves to be the leaders in our "new normal".
You will want to take a good long look at the SPY charts below. They are the most recent Broad Market Trend as of this past Friday.
The one on the left is the SPY with Volatility Trend and the one on the right is the same SPY chart with Price Action Trend. Both are proprietary technology that I have developed to give me a strong indication of the current volatility and price trends of a stock or ETF.
When used on the SPY ETF it's called the "Broad Market Trend" since the SPY is comprised of the 500 strongest stocks in the United States and is considered a very good measure of the overall US financial markets.
As you can see from the chart above, the markets have settled down quite a bit in the prior weeks with the SPY ETF consolidating just under a major resistance area. In recent weeks, since the March 23rd low was put in, there have been many growth stock names that have taken off and are showing continued strength working to prove themselves to be the leaders in our "new normal". We are going to review some of those names in a bit.
After a constructive week for the coronavirus market rally, several leading stocks may be worth taking a closer look. If you are trend follower, and if you weren't already tip toeing back into the markets after the harsh sell off, then take a look with me at where we are now with both volatility and trend to see why now might be a good time for you to be getting more bullish.
Assuming the markets continue to consolidate and / or move higher, these names will be just some of those that an astute trader will want to be looking for rewarding trading opportunities. If any of these names are not already on your watch list, now may be a terrific time to update your hot list with them, as my expectation is they will continue to show strength, with ample trading opportunities, in the coming weeks, if not months ahead.
Here are some trade ideas for your review including risk graphs, and rationale of some stocks that I have either been trading in recent weeks, or are looking to trade in the coming weeks using data as of this past Fridays market close.
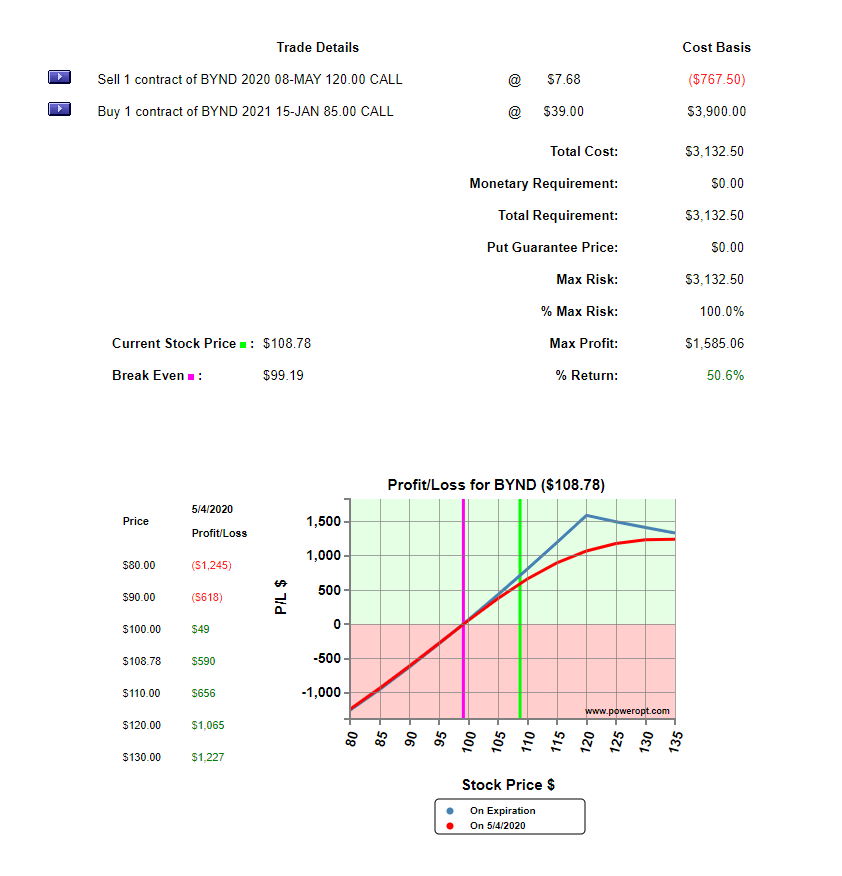
Behond Meat: Ticker BYND
BYND recently inked a deal with Star Bux opening the doors to the China markets with their product. Quarter over quarter rising revenues and earnings and an increasing number of brokers adding it to their buy list make this an attractive long play over the coming weeks, (months?):
| 14 Brokers Making Recommendations | |
| Recommendation | # of Brokers |
| Strong Buy | 3 |
| Moderate Buy | 0 |
| Hold | 9 |
| Moderate Sell | 1 |
| Strong Sell | 1 |
Risk graph with long call Jan 2021 LEAPS and near month short call weekly trade idea:
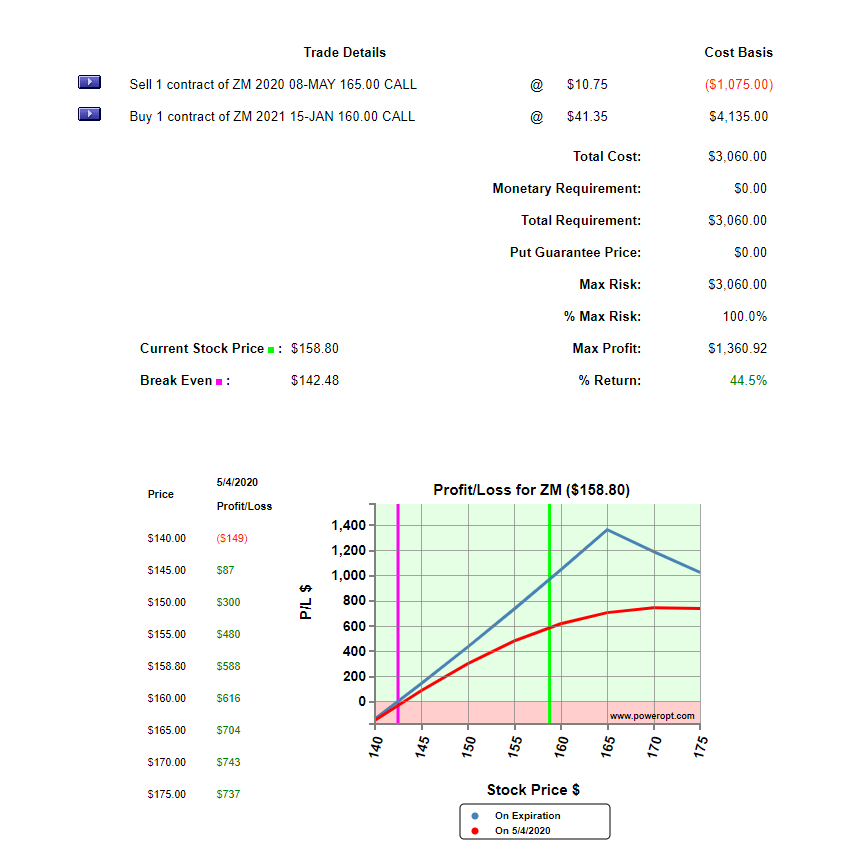
ZOOM: Ticker ZM
Zoom has been experiencing explosive growth in their business with a trifecta as usage of their communications platform grows in business, schools, and personal user base. Quarter over quarter rising revenues and earnings.
| 21 Brokers Making Recommendations | |
| Recommendation | # of Brokers |
| Strong Buy | 7 |
| Moderate Buy | 1 |
| Hold | 12 |
| Moderate Sell | 0 |
| Strong Sell | 1 |
Earnings Per Share
Last Quarter $ 0.05
Surprise 600%
Consensus Estimates Next Quarter $ 0.01
This Fiscal Year $ 0.02
Next Fiscal Year $ 0.00
Risk graph with long call Jan 2021 LEAPS and near month short call weekly trade idea:
Procter and Gamble: PG
Procter and Gamble is one of the oldest dividend aristocrats, with a string of 50+ years of continued dividend increases. This is a rare achievement, and speaks volumes for the continued strong management team that runs such a large organization. With a recent earnings beat they continue to maintain strong leadership in the consumer staples sector.
| 13 Brokers Making Recommendations | |
| Recommendation | # of Brokers |
| Strong Buy | 10 |
| Moderate Buy | 1 |
| Hold | 2 |
| Moderate Sell | 0 |
| Strong Sell | 0 |
| Earnings Per Share | ||
| Last Quarter | $ 1.17 | |
| Surprise | 4.46 % | |
| Consensus Estimates | ||
| Next Quarter | $ 0.99 | |
| This Fiscal Year | $ 4.95 | |
| Next Fiscal Year | $ 5.21 | |
Risk graph with long call Jan 2021 LEAPS and near month short call weekly trade idea: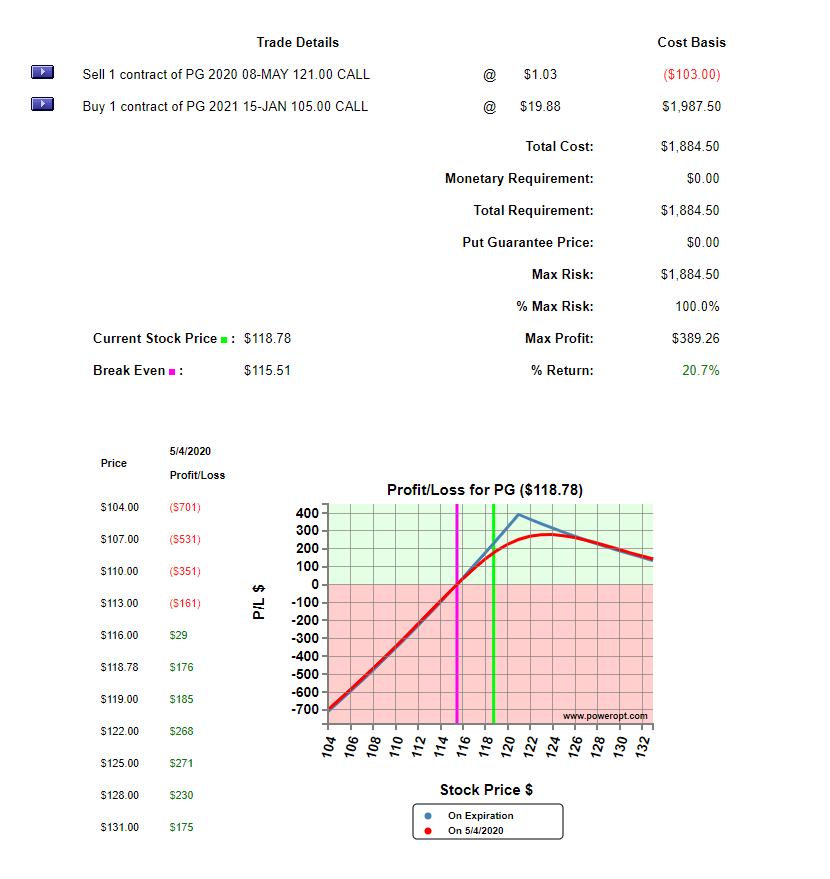
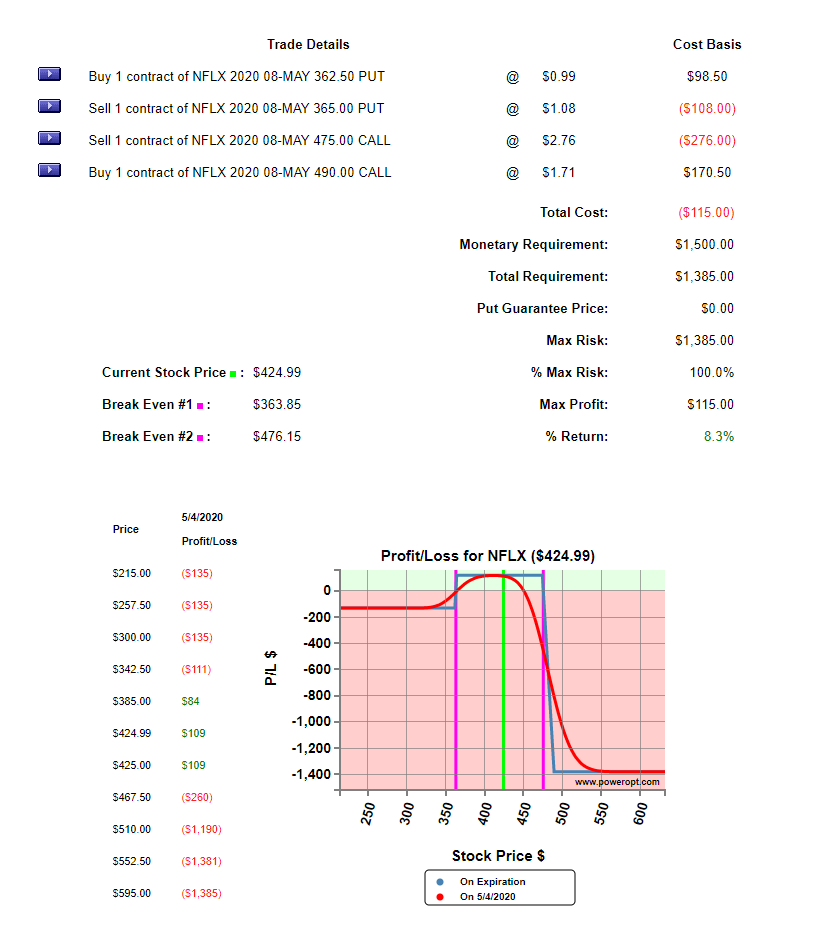
Netflix: NFLX
On April 22nd, Canaccord Genuity maintains Netflix (NASDAQ:NFLX) with a Buy and raises the price target from $450 to $500. On April 23rd, Netflix reported first-quarter global streaming subs of 182.86 million, up 22.8% year-over-year, and 15.77 million global streaming paid net additions. They also recently inked a new content creation deal as they continue to prove that they are an industry leader with quarter over quarter rising revenues as well as earnings over prior 4 consecutive quarters. Some additional technical data on NFLX which are appear interesting:
| Range Today: | $415.88 to $427.17 |
| Trade Time: | 4/24/2020 4:30:19 PM |
| Industry: | Entertainment |
| Z Score: | 4.00 |
| Z'' Score: | 10.01 |
| Springate: | 0.10 |
| % BB (20): | 74 |
| % Band Width (20): | 29 |
| BB (20) Lower-Upper: | 338.70 - 455.00 |
| Prev. BB (20) Lower-Upper: | 335.30 - 452.20 |
| Held By Institution: | 83 % |
Risk graph iron condor trade idea with weekly options:
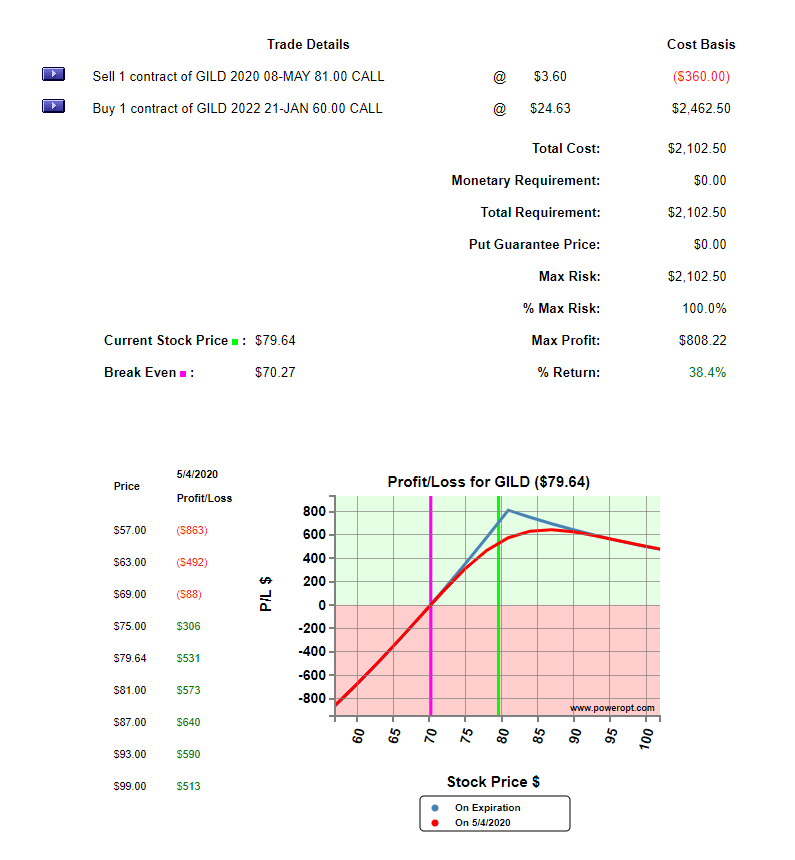
Gilead Sciences, Inc.: GILD
Gilead Sciences has earnings to be released shortly. Having its share of recent volatility, with surely more to follow, most analyst seem to have it on their bullish list as the following chart shows although one seems to think its a strong sell:
| 21 Brokers Making Recommendations | |
| Recommendation | # of Brokers |
| Strong Buy | 7 |
| Moderate Buy | 2 |
| Hold | 11 |
| Moderate Sell | 0 |
| Strong Sell | 1 |
Next Earnings Report Date 4/30/20.
They are paying out a decent dividend with LEAP and weekly options available:
| Sector: | Healthcare |
| Next Earnings: | 4/30/2020 After Market (conf.) |
| Last Dividend: | $0.68 |
| Ann. Dividend (%): | $2.72 (3.5%) |
| Last Ex Dividend Date: | 3/12/2020 |
| Last Split: | 1/28/2013 - 2:1 |
Risk graph with long call Jan 2021 LEAPS and near month short call weekly trade idea:
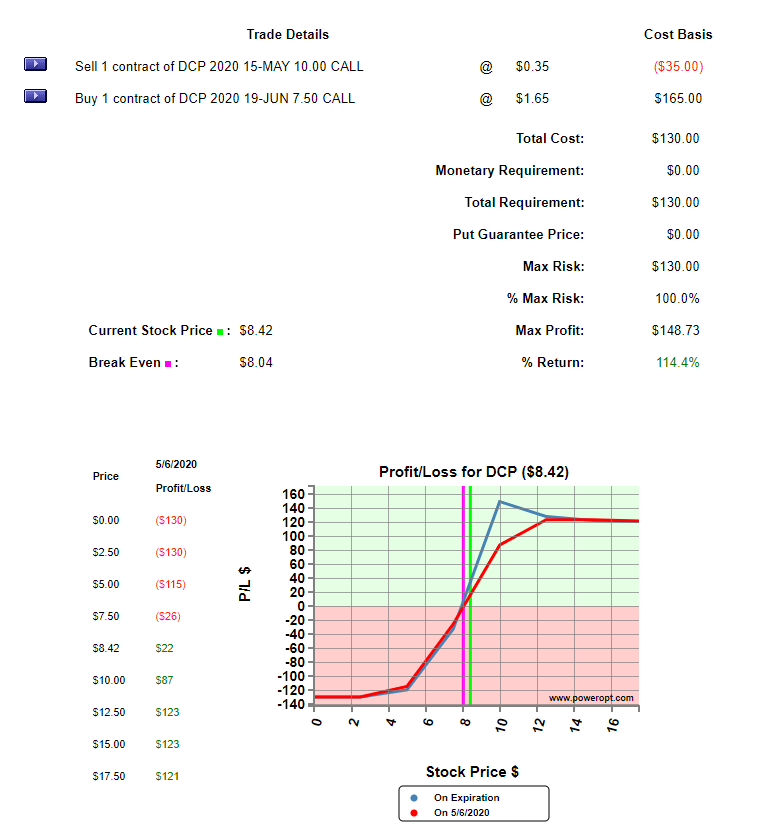
DCP Midstream LP: DCP
For those of you that have been watching the rout in the energy sector, but looking for a potential play and feel like you are missing out, DCP seems to me to be interesting at these levels. On my radar a few months ago, I noticed it was paying out a huge dividend while trading over $20 / share. Recently it has cut its dividend, and now under $10 / share after coming off a $2.20 low back in March. Has the energy sector bottomed, and will DCP recover from here? Only time will tell.
| Earnings Per Share | ||
| Last Quarter | $ 0.37 | |
| Surprise | 27.59 % | |
| Consensus Estimates | ||
| Next Quarter | $ 0.42 | |
| This Fiscal Year | $ 1.33 | |
| Next Fiscal Year | $ 0.78 | |
Since LEAPS are presently available, here is a potential play showing a risk graph with a long call and near month short call using monthly options as a trade idea:
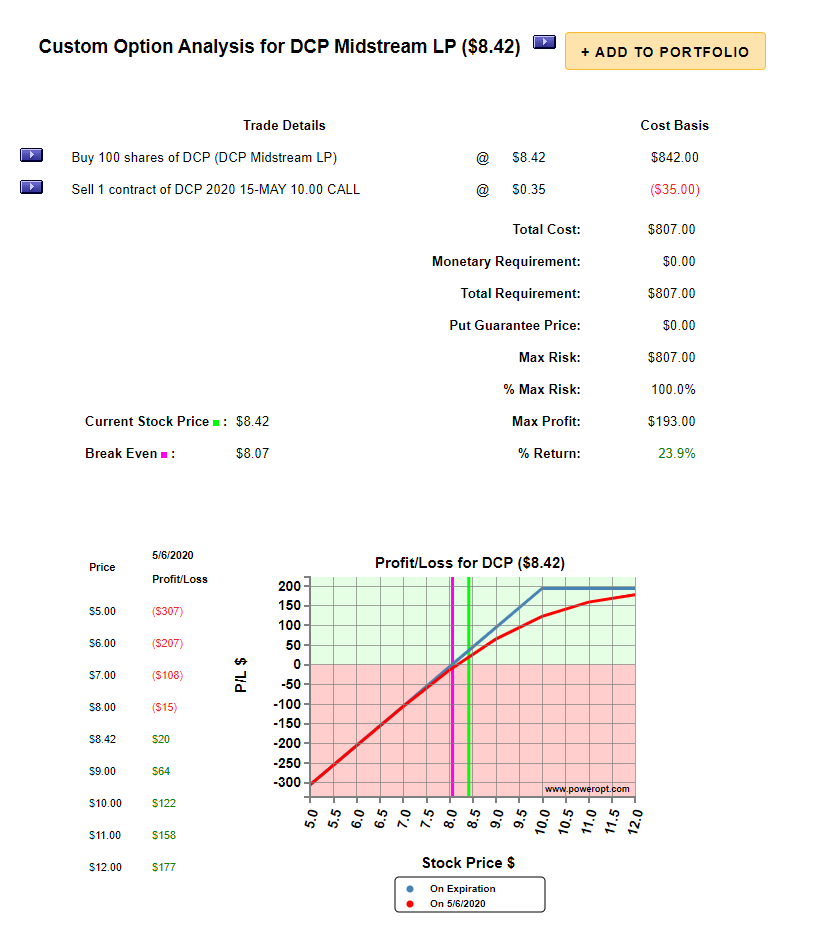
If thinking maybe to own the stock outright on this one, to possibly continue to write front month calls going forward, a risk graph of another potential play would be as follows:
I hope the information provided, with the included risk graphs, and trade ideas, have given you some good insights into a few of the recent stocks I have been trading, or are looking to trade.
I may or may not be putting on these same exact trades as laid out, depending on which account I am managing, and market conditions as they continue to unfold dynamically over time.
Make sure in doing your own research to be comfortable with taking on whatever risk on a trade you choose to make. Remember to bat for singles, with consistency, over time, and to diversify, is how the game is won. And the the proverbial "Holy Grail" to trading rests between your two ears.
Wishing you the best of success in your trading, and everything that you do, hoping you and your family stay safe in these uncertain times as the world continues in moving forward to find its "new normal."
Disclosure: I am/we are long BYND, PG, SPXL.
Additional disclosure: I am considering initiating a position in all aforementioned tickers, if not already in a position. I either recently had positions in these names, currently have positions in these names, or may be taking positions in any of the proceeding names within the coming days or weeks ahead.
Disclaimer: Stocks, Options, and Futures have large potential rewards, but also large potential risk. You must be aware of the risks and be willing to accept them in order to invest in the futures and options markets. Don't trade with money you can't afford to lose. This is neither a solicitation nor an offer to Buy/Sell stocks, options, and / or futures. No representation is being made that any account will or is likely to achieve profits or losses similar to those discussed. The past performance of any trading system or methodology is not necessarily indicative of future results.