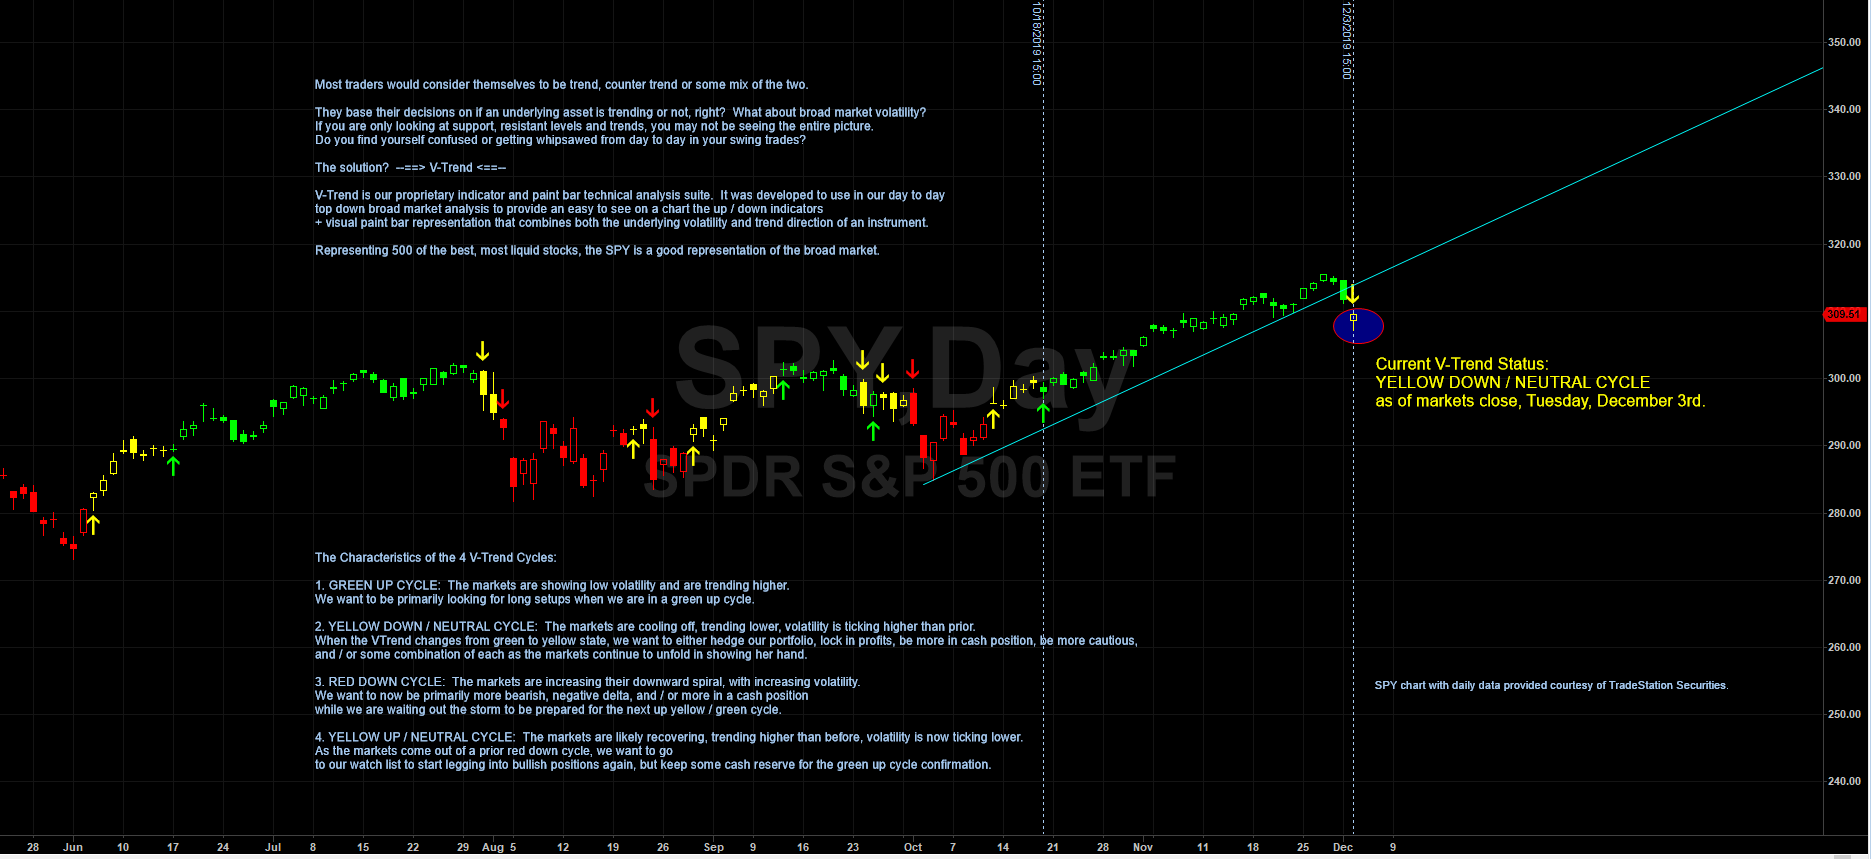
On Monday, we had a break of trend line support, on the SPY daily chart on one of the larger down days we have had for a while (as you can see from the attach graphic). Today we had a gap lower, more selling, with the market finishing up on a positive note closing price > open price. Even so, our broad market trend indicator has now officially turned yellow from green where it had been since well over a month.
While a yellow indication is not to be considered a "prediction" of what is to come, markets do in fact cycle from low to high(er) volatlity, uptrend to down trend, so only time will tell, however the more active / shorter term trade manager (ie. swing trader) may want to consider hedge their positions / portfolio (if not already), to be in more of a neutral and / or cash position, be more cautious / less agressive to the upside, etc...