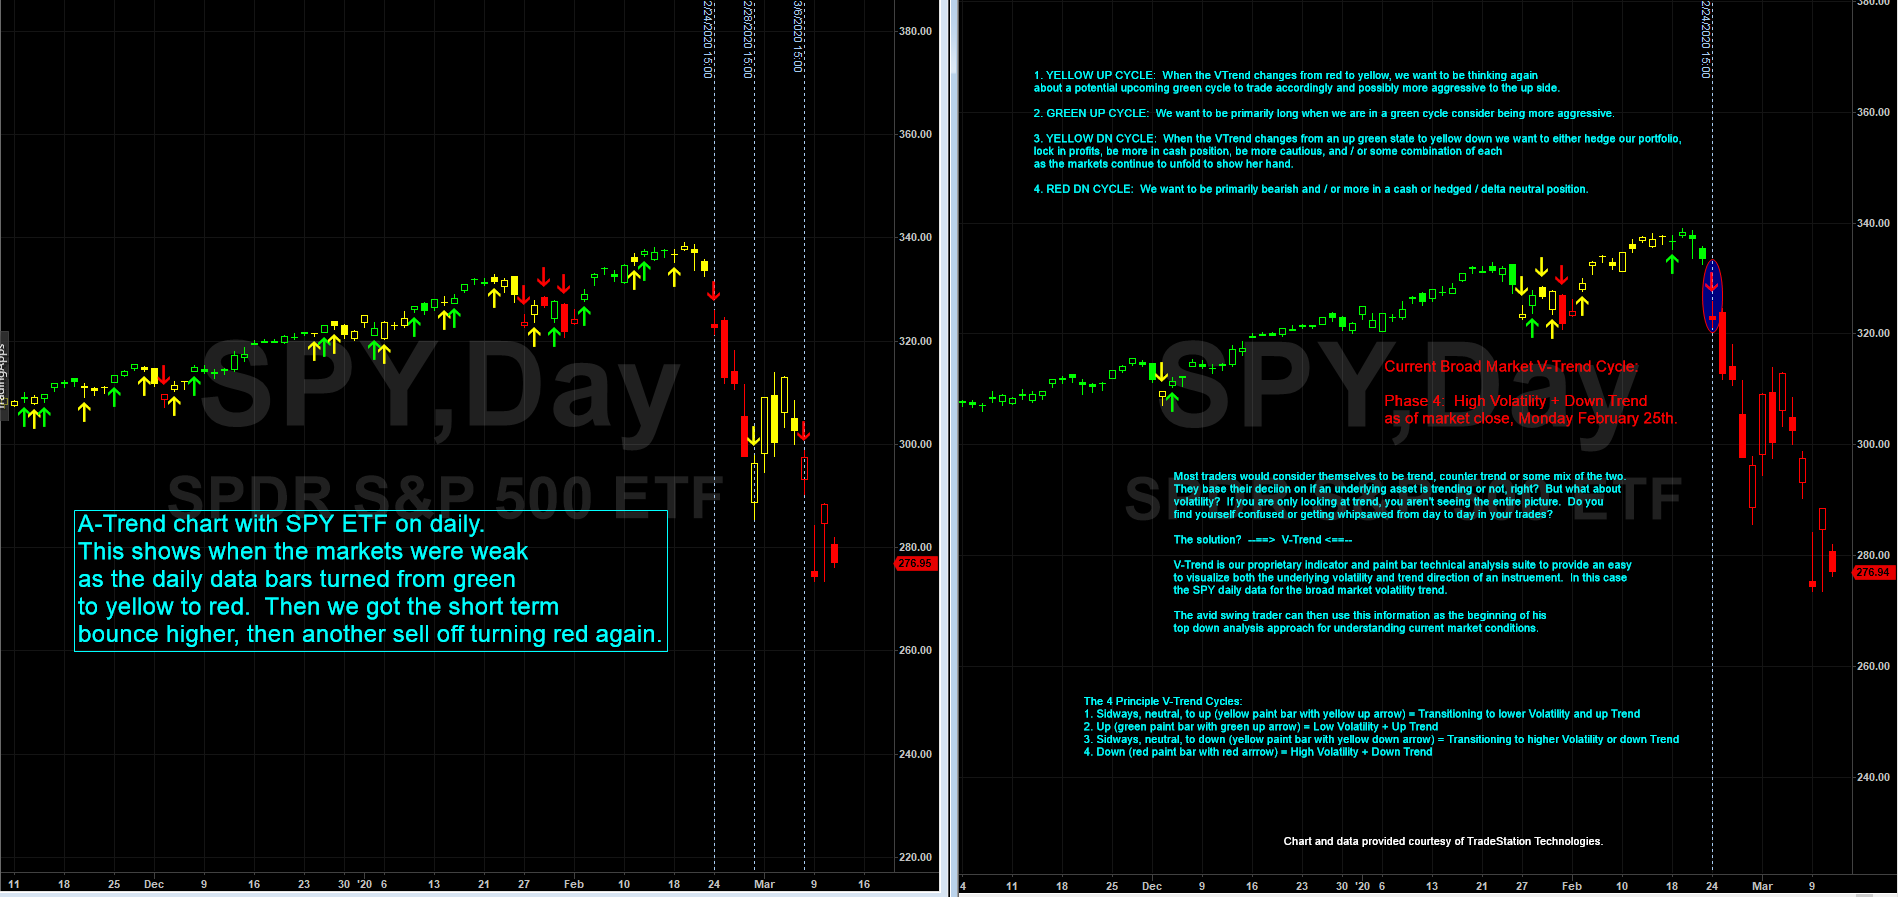
Coming up 10:30 CST, taking a look at where we are with the broad market, today I have put two charts up side by side. Both of the daily SPY with the one on the left containing A-Trend analytics, and the one on the right with V-Trend. A-Trend spcifically shows the trend of the chart. V-Trend shows the trend, taking into account volatility.
What do both A-Trend and -Vtrend tell us?
1. The markets are clearly in a down trend after a short lived bounce higher 2/28 - 3/6.
2. The markets have more volatility than normal.
How long will the markets continue to go lower? There is no way to know for sure, except when the markets start to turn, we will find A-Trend turning yellow / green, combined with V-Trend turning yellow / green.
For a bull market to develop, and take hold, that is what we want to ultimately be looking for in the charts, based upon technical anlaysis, and how the A-Trend and V-Trend market analytics were designed to display.